

Tutorial
Part of my Master’s thesis, which I wrote here at Centigrade as a student trainee was to design a mobile application for more sustainability in daily life. Due to the focus on personal energy consumption, the main goal of the application was to create more transparency and generate awareness of the background story of energy transition. The intended effect was to hopefully initiate a possible behavioural change of the potential users, inspired by works of serious games (for change). Essential for this project obviously was – next to a proper usability and an appealing look – to create a motivational design, which tries to engage the user on the long-term. Due to those goals, it was an easy decision to take a look at gamification and its specific possibilities regarding user motivation. But my main challenge in the generation of a concept could be summed up in the question: How to design for an unknown user?
Where to search for common ground, when you are working with a wide range of different users? Photo: Jay’s Brick Blog
Quest 1: Find some suitable users
If you haven’t got a specific user type or persona to design for, you have to find out by yourself. To address this problem, quite a lot of instruments and questionnaires exist in the orbit of psychological methodology. Unfortunately, most of them are too unspecific to be used within a technical-driven context. If you take a look within the area of games user research instead, you will likely find Bartle’s taxonomy of player types. Bartle’s model is often quoted and well known as ‘classical player type model’ when it comes to player studies or videogame based research. But less known is, that Bartle built up his model of Socializers, Explorers, Achievers and Killers for a very specific group of MUD (multi-user dungeon) players and was not based on empirical data. To make a long story short: If you want to identify some sort of gamification user types for your own specific use case, you have to create an own questionnaire from scratch.
One of my questionnaire’s main guidelines was to design a lean and quickly operable study which combines users from a wide population with motivational stereotypes in form of different gamification user types. One remarkable online study in this research area is currently being hold by gamification researcher Andrzej Marczewski. His model of intrinsic user types was the basic concept for my own questionnaire: I used his interpretation of Philanthropists, Socialisers, Free Spirits, Players and Achievers and started generating questionnaire items for each of those player types.

Philanthropists are people, who want to be part of something meaningful with a greater purpose. They usually help without requesting something in return and are mostly driven by knowledge sharing and gifting. Also socially influenced but more focused on communication and relatedness is the Socialiser. He is often motivated by social status, social discovery or competition. More focused on his own pleasures is the Player user type. This one is mostly referable to a ‘classic player’, who plays for his own sake and is mostly interested in rewards and rankings. On the other hand, a substantial part of users – especially in gaming environments – is searching for fulfilment in creative actions. Marczewski called them Free Spirits. The last of the considered user types is the Achiever. He is mostly driven by mastery in form of learning, challenges and progression.
Quest 2: Developing a study
In the first step of the questionnaire creation I generated four statement items for each of the user types described above. An additional set of four ‘hybrid items’ were also created which addressed a combination of two types. All items were pretested within a small qualitative evaluation of eight subjects (equally split in female and male participants). One of my personal requirements for this survey was a completion time of less than two minutes. I’ve got a few bad memories of never-ending surveys from my student days that still appear in my nightmares – so I didn’t want to scare off my study participants.
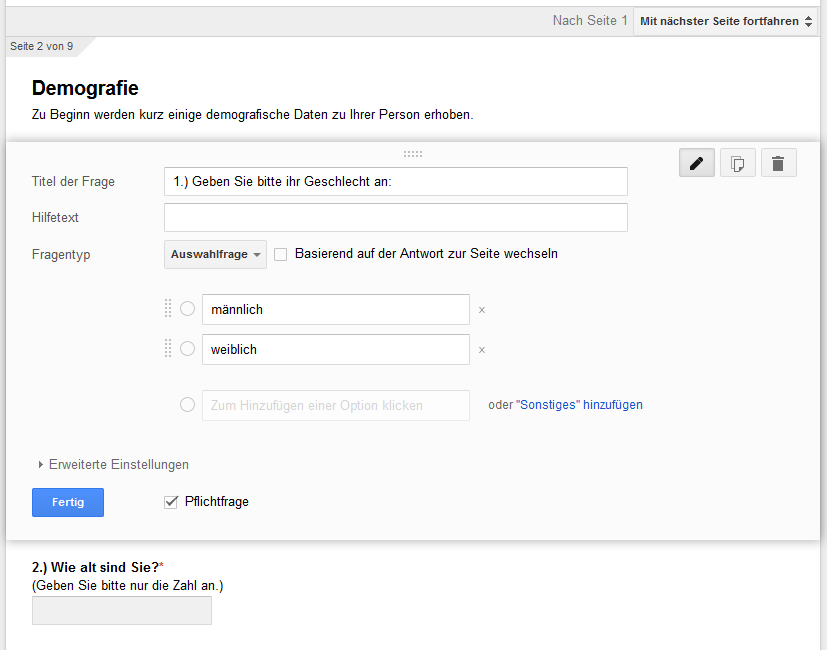
I used Google Docs for my survey. The results were automatically transferred into a Microsoft Excel-file.
First of all, I started with collecting demographic data of all participating subjects like age, gender, profession and level of education. Subsequently, the participants were asked four questions about their lifestyle. This included the size of their households in number of persons, if they were managing it by themselves, if they were using a smartphone or tablet and finally how they assess their activity regarding sustainability issues in daily life (4-point Likert-scale). The test continued then with its main part: Four succeeding packages of six items each (five per user type + one hybrid). In this case, the participants had to select none, one or two of the items per package, which they could identify with the most.
Level Up: You’ve got results!
121 subjects took part in my survey. They were split in 53% female and 47% male participants – a balance you usually can only dream about in research. The youngest participant was 16 years old, the oldest one 63 years; average age was 31.4 years. 96% of the participants stated to regularly use a smartphone or tablet. 38% of the subjects had an academic background. The survey showed a very variegated range of stated professions. Some examples are assistance doctor, businessman, cleaning personnel, firefighter, industrial engineer, mortician, music producer, nanny, student or tire vulcaniser. All in all a very welcoming effect, because sustainability issues – the context of my design study – address everyone at last.
The survey revealed some interesting inferential aspects as well: It was shown, that there is no significant correlation between the household size and the self-assessed sustainability of the subjects. Besides, women claimed themselves more interested in sustainability issues than men and overall participants younger than 30 years seemed to be less interested than the ones who were older than 30 years.
For the evaluation of the item selection I focused on the absolute frequency. Thereby it was possible to quickly recognise the different user type categorisations on a descriptive level. In addition, I broke down the results into two grades of user types for every participant based on the first and second highest amount of his selections. The following extract of the data set explains one of those user type deductions:
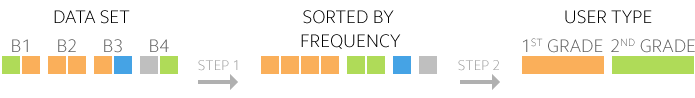
A user selected two items in each item package (B1-B4). Those items were coloured corresponding to the user type they addressed. In step 1 I sorted them in descending order based on their absolute frequency. During step 2 I only focused on the first and second highest user type occurrences and determined them as primary (1st grade) and secondary (2nd grade) gamification user types for each participant.
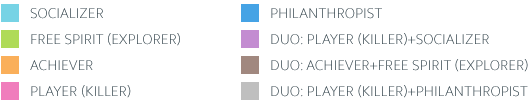
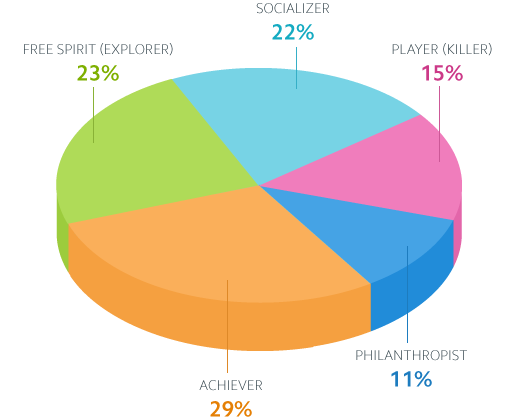
Due to the colour key we can see that for example the subject from the shown data extract was related primary as an Achiever (orange) and secondary as a Free Spirit (green) user type. The overall evaluation of the data set showed the following results:

1st Grade User Types
2nd Grade User Types
So far, so good, but the absolute user type rates are not the only important thing to consider within the design process: The relative rates of item selections can have a meaningful impact on the intended user experience, too. The next extract shows the top 10 rates of our survey participants.

Even if the participants could mostly be categorised as Philanthropists – the motivational design should accordingly base on mechanics like care-taking, gifting and collaboration – this chart for example shows, that 71.9% of all subjects also prefer a clear communication and transparent progression through the system; a traditional Achiever characteristic.
To know what your potential users want is good, to know, what they don’t want, sometimes can be even better. So let’s take a look at the top 3 of the least selected items:
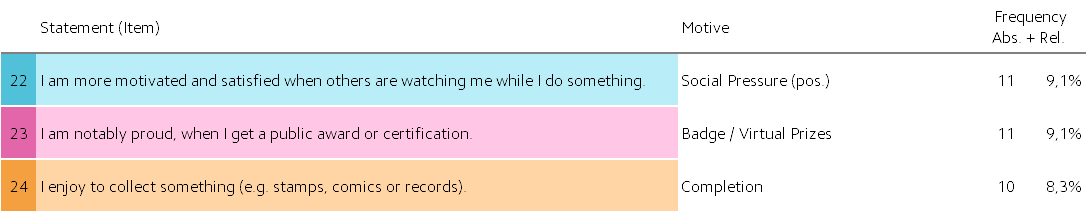
Distinctive on this results especially is, that the item which addressed ‘badges’ – the number one thing in mind for many people when it comes to gamification – has been selected second least. This is only one indication, that gamification has to be much more than ‘points & badges’ to deliver a motivational experience.
Conclusion
If you are working on a use-case, design study or research project you will probably face the problem of a missing ‘real-life’ user to design for. In this cases you have to gain your data through empiric evaluations, which provide the relevant information to generate personas, clarify context and determine requirements of your project. Therefore it is recommended to collaborate with colleagues from disciplines like market research, human relations or social psychology to develop your own specific evaluation instruments if needed. The gathered data is not only helpful for the first steps of your project, but can be also used as guidance for the selection of test subjects throughout the whole development process.
In my case, the shown results helped me to base my gamification design upon two stereotypical user type models: The Philanthropists and the Achievers. This was especially essential for the selection process of the used gamification mechanics, because there is always a danger of mechanics working ineffectively and becoming demotivating at worst if they are combined with an unsuitable user type.
More Information
A shorter version of this blog entry was also published at Organic Social.
For some visual impressions of my thesis, of which this study was an essential part, please feel free to visit Instragram #appshamrock.
